Performance of the NSW Tier 1 and 2 community housing sector
As at 30 June 2019, of the 34 Tier 1 and 2 CHPs with NSW jurisdiction, 24 had at least one completed standard compliance assessment in the reporting period 2018/19.
The Registrar conducted a total of 26 standard compliance assessments, a further seven assessments in progress at the end of the reporting period and 10 targeted assessments were completed. Of those who had a standard assessment, two CHPs had two standard compliance assessments completed and nine had at least one targeted assessment completed.
Of the total 34 CHPs, five CHPs had both a standard and targeted assessment completed, one CHP had two targeted assessments completed and three CHPs had one targeted assessment only.
The Registrar notes these CHPs are subject to other programs of intensive scrutiny and has sought to include those layers of scrutiny within the assessment process to reduce red-tape. Such scrutiny includes CHP reporting to other jurisdictions (such as ACNC and Aged Care) as well as the many layers of contract reporting levied on CHPs in NSW.
Trends in Recommendations
Trends in recommendations made by the Registrar to improve provider performance are an indication of the health of the Sector. Overall trends indicate CHPs registered under the NRSCH are very responsive to continuous improvement and invest in better practices.
Of the 24 standard compliance assessments completed in 2018/19, 19 CHPs received recommendations in their final report.
The Registrar notes that CHPs responded well to draft report recommendations. There was a total of 38 recommendations made at draft report stage across the 24 CHPs. Five CHPs addressed recommendations between draft and the final report, with a reduction of 8 recommendations overall.
Of the 24 CHPs assessed, five received no recommendations, of these, two had improvement opportunities. A total of 27 improvement opportunities were suggested across the 24 providers.
The Registrar found no improvements necessary in Performance Outcome 3 (Community Engagement), with no CHPs receiving any recommendations in this area. This is consistent with the previous financial year. Performance Outcome 6 (Management) also saw no recommendations given in this financial year.
The Performance Outcome which saw the largest number of CHPs (7) receive recommendations for 2018/19 compliance round was Performance Outcome 1 (Tenant and Housing Services). This Performance Outcome also saw the largest number of recommendations given (13). This Performance Outcome also saw the most number recommendations made in the previous reporting period 2017/18 (26 recommendations were given).
Of all CHPs who received recommendations in Performance Outcome 1, the majority received recommendations related to managing complaints, among other recommendations; indicative of the Registrar’s focus on improving performance in this area (especially prior to the expansion of tenant numbers expected under the NSW social housing management transfer program). While this has been an area of continuous improvement for CHPs, the Registrar notes there is no comparable human service outcome reporting for public housing for comparative purposes. Also aligned to this expansion, the number of complaints has risen significantly from the last reporting periods (2017/18) to this year (2018/19).
Comparisons between recommendations made in the previous year can be difficult.
In 2017/18 there were 28 Tier 1 and 2 CHPs who completed a standard compliance assessment, four more than the 2018/19 financial year.
There was a total of 77 recommendations given for the 2017/18 compliance assessment round across the 28 CHPs. This is 50% reduction in the number of recommendations between the two reporting years. All Performance Outcomes saw a reduction of recommendations given, a significant improvement across the Sector.
The largest number of recommendations made were in Performance Area 1 with 26 recommendations given to 17 providers. This Performance Outcome had a 50% decrease in comparison to the number of recommendations given for the 2018/19 compliance assessment round, along with 10 less providers receiving recommendations.
In 2017/18 there were 72 improvement opportunities made across 28 CHPs, while in 2018/19 there were 27. This is a significant reduction in comparison to the previous financial year, noting there were four less providers assessed.
Improvements seen in Performance Outcomes could be attributed to a more focused and targeted effort on these Outcomes in the preceding year. For example, in 2017/18, 35% of Tier 1 and 2 CHPs were given recommendations in Performance Outcome 5 to address weaknesses around the quality of their conflict of interest (COI) policies and 11% were suggested improvement opportunities regarding a disconnect between policy and practice of COI management. These figures triggered a need to further understand current practices and to determine how best practice in COI management can be achieved in the Sector. In the 2018/19 assessment compliance round a Campaign has focused on improving those practices.

Assets
As at 30 June 2019, the Registrar regulated 155 CHPs who managed over 47,000 properties, this included assets held in NSW and assets in other states managed by CHPs with primary jurisdiction NSW. There has been an overall increase in assets regulated by the NSW Registrar over the last two years from 40,821 assets in June 2018 to 47,144 assets in June 2019, a difference of 6323. There are around 40,600 assets located in NSW, the remainder sit across other jurisdictions.
Despite the increase (predominantly being in the Tier 1 Sector), the true growth in new units of accommodation is not reflected in these numbers. Using asset numbers to calculate the growth in new units of accommodation is unreliable and problematic, although gaining a deeper understanding at an individual CHP level helps to estimate the areas where asset numbers have changed/increased. Therefore it is estimated the true growth in the Sector is minimal, potentially around 100 -200 properties.
There are a range of factors to understand the limited net increase in assets such as:
- NSW Government programs such as the NSW Social Housing Management Transfers and the Social and Affordable Housing Fund (SAHF) have occurred in the Tier 1 and 2 Sectors increasing asset numbers. Although not all CHPs at the time of reporting had accounted for the increase in property numbers, it is estimated this increase is around 1600 properties since last financial year. Transfers increase properties managed by CHPs but do not lead to an increase in social housing numbers overall. A significant increase is also expected for the next financial year given transfers continue into the 2019/20 financial year. Most of these are tenanted, others are new units (under the SAHF).
- The Registrar has encouraged CHPs to register at least 700 - 800 affordable housing properties that were not accounted for in the last reporting period (2017/18). Accounting for affordable housing properties can be quite confusing when overlaid with social housing properties. The Registrars are working to improve the data quality in this area and will pursue options such as issuing guidance material, validating increases in asset numbers at compliance assessments and also collecting property level data into the future.
- One new Tier 1 provider (managing affordable housing properties) was registered with the NSW jurisdiction who manage a large portfolio of assets (over 3500), although most of those assets are in other jurisdictions.
- Some CHPs have increased their portfolios through development of new units.
- Aboriginal housing providers are seeking registration under the current NSW strategy to transition these providers to an established regulatory regime. These providers bring existing social housing stock. For example one new Tier 2 Aboriginal provider has been registered who manage over 300 existing properties.
- Tier changes can impact on asset numbers, not reflecting true growth but more a shift in where the assets are recorded, although this does not affect overall asset numbers.
- Cancellations of CHPs (in the Tier 3 Sector) has seen assets shift to higher Tiers via amalgamations.

In terms of property numbers the sector is dominated by a relatively small number of large providers. For instance the NSW Registrar currently has registered 122 Tier 3 CHPs, however each of the top five Tier 1 providers hold more properties than all Tier 3 CHPs combined. The Registrar is working at enhancing its reporting systems so this graph, along with others, will be updated in real time on its website.
Trends in non-financial performance outcomes
Reporting against metrics varies across provider and accommodation type. The Registrar uses these margins as indicators for monitoring and not as specific measures of provider performance. The following performance data is based on 24 CHPs with a completed standard compliance assessment in the reporting period 2018/19. There are no comparative performance metrics available with non-registered Sectors within social housing such as public housing and Aboriginal housing.
Property Utilisation
The target range for occupancy rate is greater than 75%. Of the CHPs who submitted data, 79% met the target. This is a decrease of five providers from the last reporting period.
The target range for tenancy turnaround (uninhabitable) is less than 28 days. This reporting period saw a decrease in the number of CHPs meeting the target range (42% or 10 CHPs) Last reporting period saw 50% meet the range, a change of four providers.
The target range for tenancy turnaround (tenantable) is less than 14 days. This reporting metric remained stable with the last reporting period with 54% of CHPs meeting the target.
Given this metric has historically seen adverse performance across the Tier 1 and 2 Sector, the Registrar will continue to engage with the Sector to improve data quality in reporting on this area with an aim to reducing the ambiguity of reporting targets. A Campaign was conducted in the 2017/18 compliance assessment round for Tier 1 and 2 CHPs, focusing on property utilisation metrics. To read more about the Campaign outcome or to see a copy of the Property Utilisation Campaign reports click here.

Rent Outstanding
CHPs continue to perform well in relation to meeting the target range for rent outstanding (target is less than 2.5%). A total of 95% (or 23 of the 24 CHPs who completed at least one standard compliance assessment) met the target with the average of 1.09% across all Tier 1 and 2 CHPs.
Tenant satisfaction rate (metric 1.4)
The target range for overall tenancy satisfaction rate is greater than 75%. In 2018/19, of the CHPs who submitted the data for this metric (21 submitted), 100% of CHPs met this range, indicating there is a large proportion of satisfied tenants. Three CHPs did not submit the data. The average satisfaction rate across the 21 CHPs who submitted is 87.6%. [1]
The target range for satisfaction with maintenance services is greater than 75%. A total of 15 of the 22 CHPs who submitted data relating to tenant satisfaction with maintenance services met this target. The average satisfaction with maintenance rate is 79%, this remains the same as last reporting period in 2017/18.
A significant increase in the NSW community housing property portfolio is expected due to government initiatives underway. Hence, it is important for the Sector and the Registrar to understand the basis for any changes and adjust performance to remedy any identified performance issues before the impacts of this expansion are felt.
To read more about the Satisfaction with Repairs and Maintenance see the Registrar’s Campaign report here.

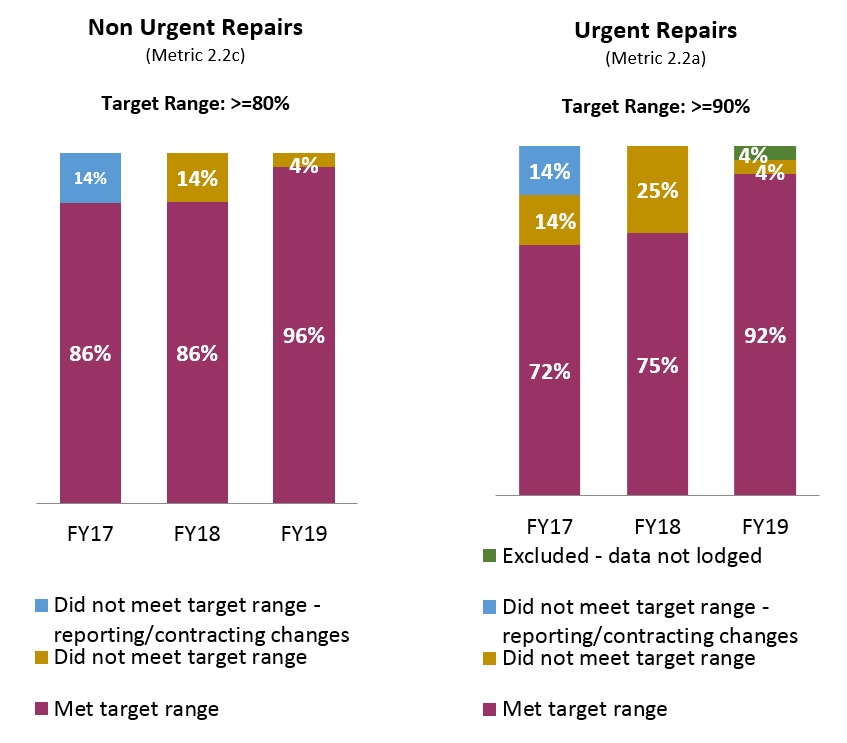
Repairs and Maintenance
In 2018/19 there was an increase in CHPs who met the target range for non-urgent repairs (target range greater than 80%) with 96% (23 of the 24) of CHPs meeting the range.
The target range for urgent repairs (target greater the 90%) saw 92% (22) of CHPs meeting the range. This is an improvement from the previous year which recorded 75% (21) of CHPs assessed meeting.
Evictions
Evictions as a portion of exits (target range less than 10%) has seen a reportable decline since the previous year. In the 2018/19 reporting period 92% (or 22 of the 24 who reported) met the range and in 2017/18, 96% of CHPs met the target range.
The average percentage of evictions across all CHPs is 4.80%, which is an increase since the previous year. Eviction rates do not coincide with the number of tenancy exits per provider. Tenancy exits for the year on average was 262. The least being a CHP with 8 exits (aged care provider) and the largest was 991 exits (a general community housing provider).
A provider who had 904 exits for the year recorded that only seven of those were evictions (or 0.7% of all exits) whilst another provider had 991 exits and recorded 89 as evictions (9% of all exits). Variances can vary markedly based on the level of holdings of affordable housing stock; which often has different eviction triggers.

Complaints
The number of complaints received by the Registrar has increased over the past two years with the steady expansion of the Sector (especially with social housing management transfers).
In 2017/18 a total of 85 complaints were received, whilst in 2018/19 153 complaints were received. This rise is commensurate with the Registrars 2017 forecast of such an increase.
The increase can be attributed to a number of factors including:
- Visibility of policies and procedures Campaign – clearer definitions of the circumstances under which tenants can make a complaint and/or appeal has driven the increase in tenants complaining, and in addition circumstances under which CHPs would make appealable decisions.
- Social Housing Management Transfer (SHMT) Program – For the 10 CHPs involved in management transfers, total complaints to the registrar increased from 33 complaints in 2017/18 to 82 complaints in 2018/19. As part of the SHMT Campaign, the Registrars engagement with CHPs involved in the program has identified a number of program design issues which have manifested requiring further consideration, ongoing monitoring and reporting. Early indicators show that there may be regulatory implications for CHPs and the Registrar, including additional resources required to report and monitor compliance, given CHP’s performance will likely decline initially following transfers as they absorb the costs of public housing in repairs and utilisation, impacting rent and complaints.
Other performance metrics
The number of governing body meetings held in the year to 30 June 2017/18 on average was 10 per provider and in 2018/19 the average was also 10. Of the 24 CHPs assessed 14 paid sitting fees while nine others did not (one provider did not provide data). Most CHPs who pay sitting fees are substantially larger than those that don’t.
Four had governing body members who are tenants of the provider.
The largest number of tenant positions for a governing body was four. This has remained the same since the last reporting period. The Registrar conducted a Campaign into the Membership arrangements of CHPs as part of the 2018/19 compliance assessment rounds. You can see a copy of the Campaign Summary report here.